Trending News


Economic slowdown explained in 4 charts
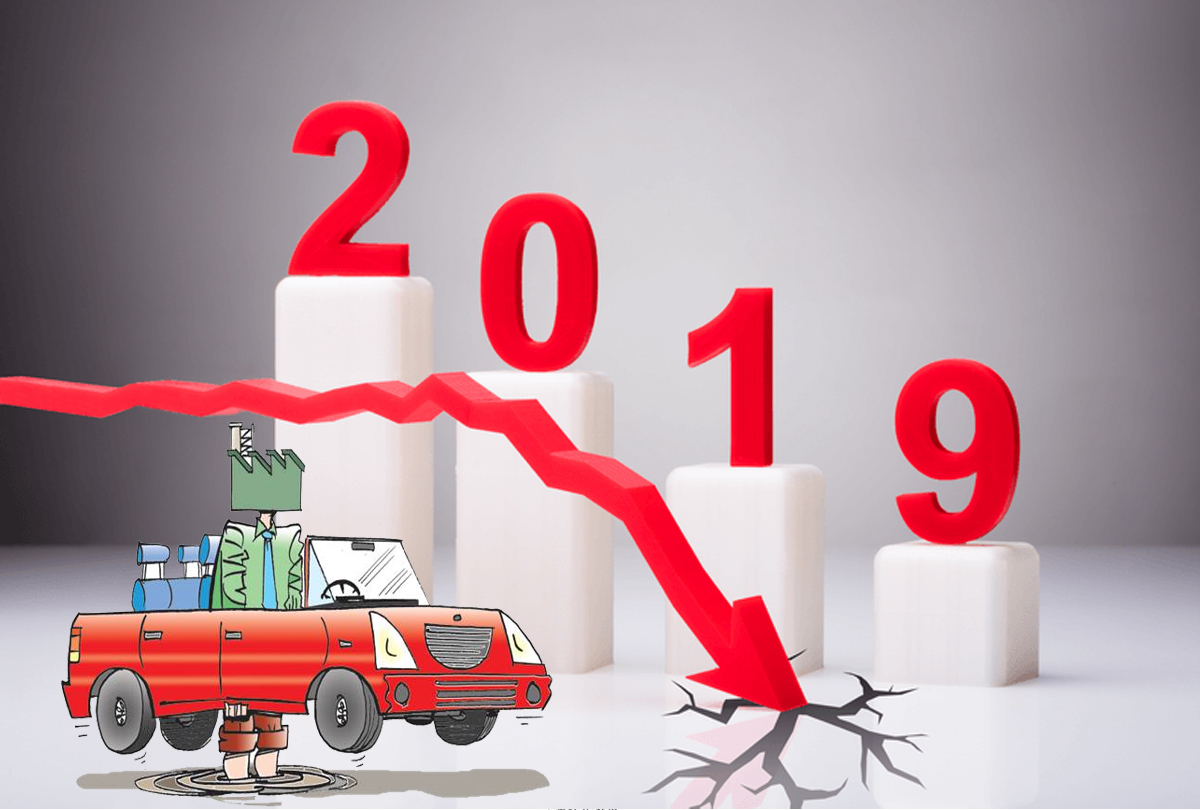


With both the private consumption growth and investment rate dropping below 5% in Q1 FY2020, the GDP growth rate has fallen to 5%. Nominal GDP growth has slid to 8%, a record low. Growth in employment intensive sectors such as manufacturing and construction has also been muted.
Distinct Slowdown- Both nominal GDP (includes inflation) and real GDP grew at the slowest-ever pace since the NDA took charge in 2014. Nominal GDP is a proxy for income growth, especially that of corporates. A slowing nominal GDP will eventually lead to low tax collections. The government estimated a 11% nominal growth in the Union Budget and over 15% of tax revenue growth.
From 12.1% growth in April-June 2018 to 0.6% in April- June 2019, the manufacturing sector experienced the biggest slowdown. This is the lowest growth in the last 6 years (barring q1 FY2018, when it shrunk because of destocking before GST implementation). For the fourth straight quarter both "mining and quarrying" and "agriculture, forestry and fishing" have grown at less than 5%.
Laggardly pace
For a while now, the rest of the sectors have had growth rates within the 5% to 10% band. In Q1FY19, construction sector, an employment-intensive sector apart from manufacturing, slowed down to a seven-quarter low (5.7%).
Underlying factors
Both Private Final Consumption Expenditure, which reflects consumption and Gross Fixed Capital Formation, which reflects investments, fell drastically in the latest quarter. PFCE accounts for more than 55% of GDP and GFCF accounts for 28 to 30% of the GDP.
Related News -

Reports of underworld don Chhota Raja...
07 May, 2021 05:32 pm
UP: 135 teachers died in panchayat el...
28 Apr, 2021 03:51 pm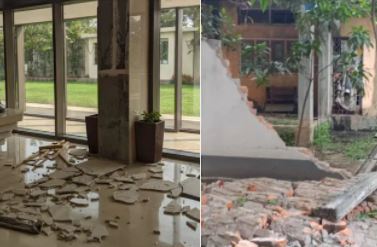
Strong earthquake in northeast includ...
28 Apr, 2021 03:32 pm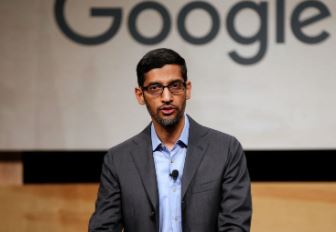
Google Support India's COVID-19 Fight...
26 Apr, 2021 12:14 pm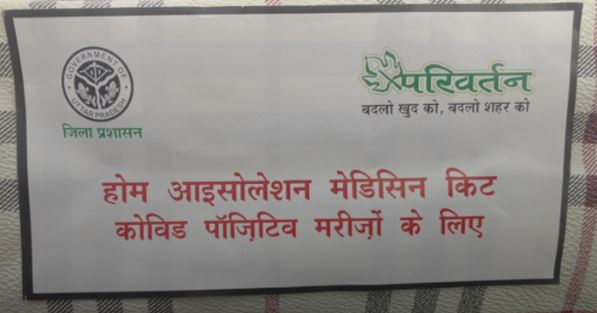
Home isolation medicine kit will reac...
24 Apr, 2021 12:38 pm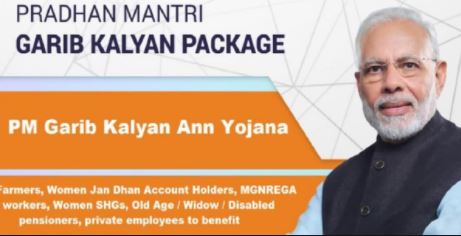
Under this scheme of the Pradhan Mant...
23 Apr, 2021 04:45 pm
Kendriya Vidyalaya Sangathan will sta...
31 Mar, 2021 02:14 pm
International magazine TIME dedicates...
05 Mar, 2021 11:53 am
IAS 2021 Application Form: Steps to...
04 Mar, 2021 01:06 pm
Underground tunnels to link Prime Min...
04 Mar, 2021 11:31 am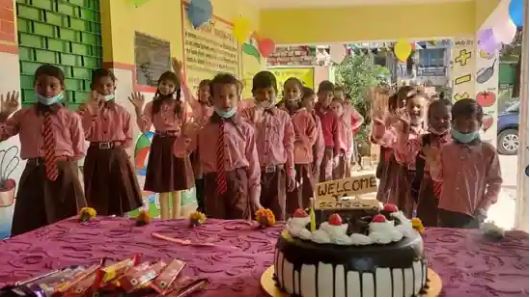
Primary school welcomes students with...
01 Mar, 2021 01:15 pm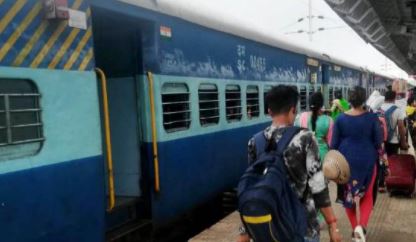
Holi Special Trains: Indian Railways ...
24 Feb, 2021 12:34 pm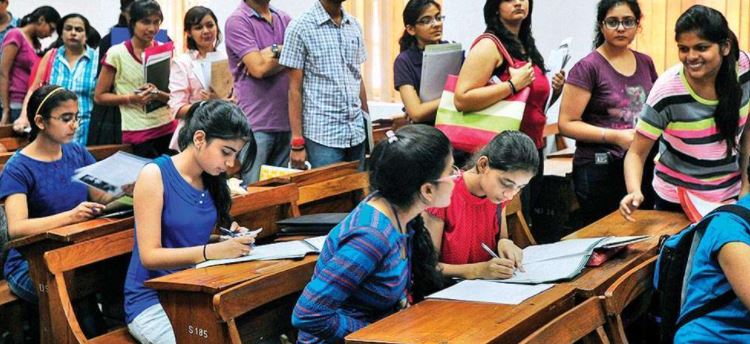
UP Colleges, Universities to Reopen f...
13 Feb, 2021 02:03 pm
Inspirational story of Manya Singh, ...
12 Feb, 2021 01:44 pm
Meet Shipra Pathak, the water woman f...
10 Feb, 2021 02:17 pm
IGNOU Admission 2021 registration for...
04 Feb, 2021 04:03 pm
Indians should decide for India- sach...
04 Feb, 2021 02:07 pm
50,000 kids in UP to attempt world re...
04 Feb, 2021 11:36 am
‘Atmanirbharta’ named Oxford Hindi wo...
03 Feb, 2021 11:28 am
Meet Ayesha Aziz, Who Became India's ...
03 Feb, 2021 10:50 amLatest News
-
2-Doxy-D is a game-changer drug - discovered by sc
-
UP Covid News: Recovery rate rises 86 percent in U
-
Big B orders 50 oxygen concentrators from Poland,

-
Today is Akshay tritiya-PM Modi and Akhilesh yadav
-
Kanpur health department doing preparations to fig
-
UP Govt. must be held accountable for "failing" it
-
16 doctors in Unnao UP resign yesterday but retrac
-
Vaccine is safety cycle against corona pandemic-CM
-
Life of every person is priceless,rescue is the be
-
Kanpur Municipal Corporation will make dust free K

-
Corona vaccination: UP government withdraws the de

-
UP Government should follow the orders of Highcour
-
Uttar Pradesh-IG roaming in the city without the u
-
PM, take off those pink goggles, by which nothing
-
Rahul Gandhi's counterattack on BJP Government’s s
-
Happy international nurse day-PM Modi, Rahul Gandh
-
Online food delivery and liquor shops can open the

-
Egoistic BJP should work in public interest instea
-
High court directed UP Government to make a Covid
-
Isolation rooms to be built in industrial units, a
-
WHO has appreciated the effort of the Yogi Adityan
-
Brother is forced to carry his corona afflicted br

-
Lucknow- Free auto service for covid patients
-
Lucknow-Defense Minister and CM Yogi inaugurated
-
Wine shops opened in kanpur
-
Kanpur: oxygen demand 50 percent decrease as infec
-
Kanpur Crime Branch Police arrested 2 accused of i
-
Kanpur police's initiative to prevent corona infec
-
CM Yogi inspected the community health center in c
-
Corona's third wave: IIT professor claims not to c
World News
-
American president Appoints Two More Indian To Key

-
Arora Akanksha an Indian running for United Nation

-
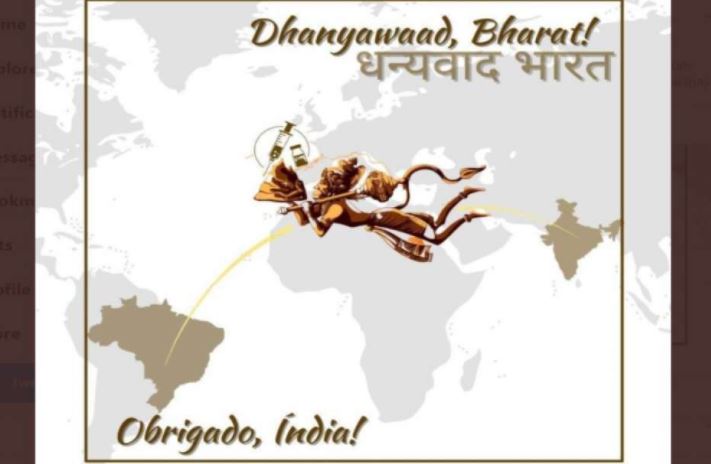
Brazil thankes india with hanuman after receiving
-
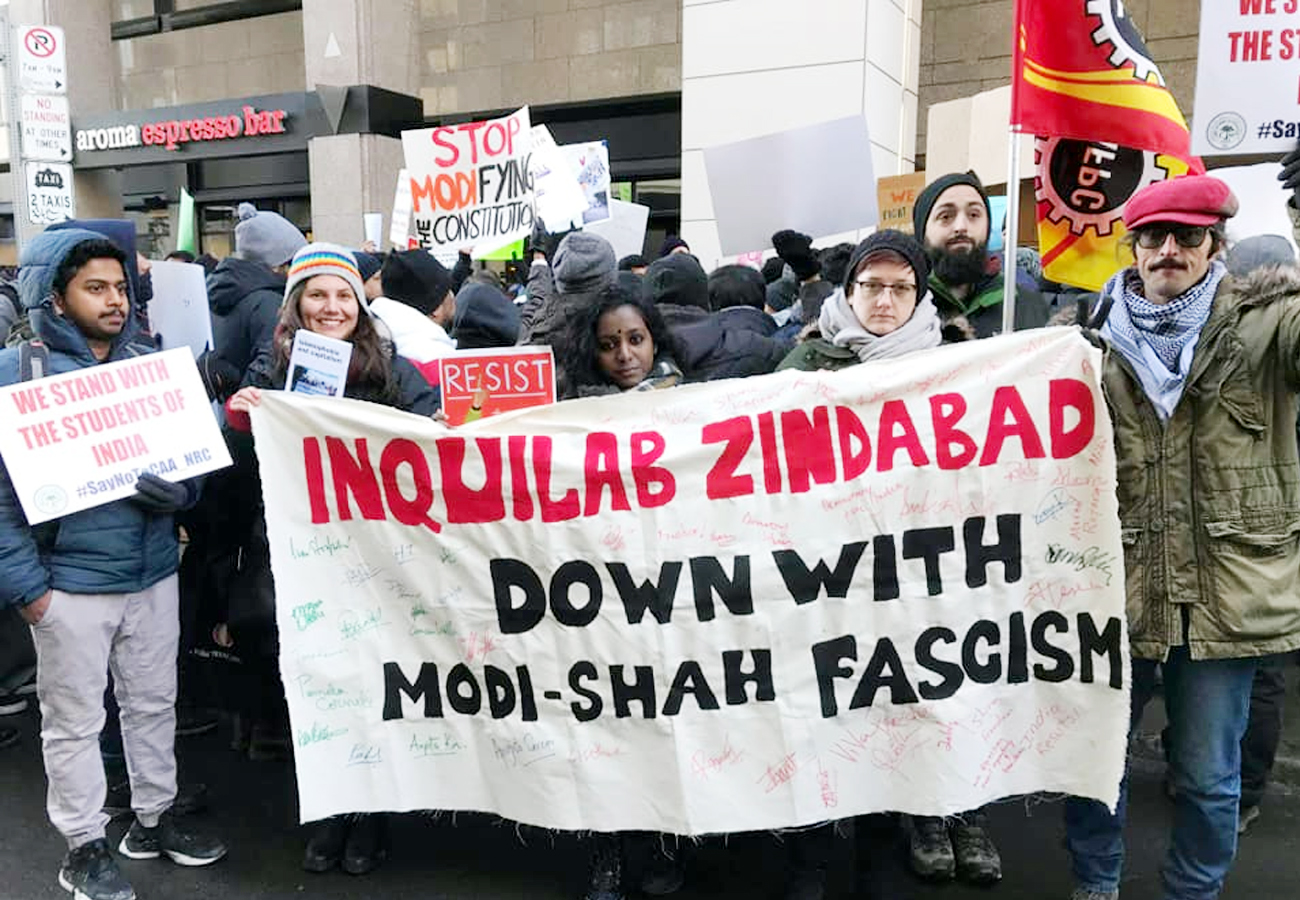
Toronto protest against Indian citizenship law as
-
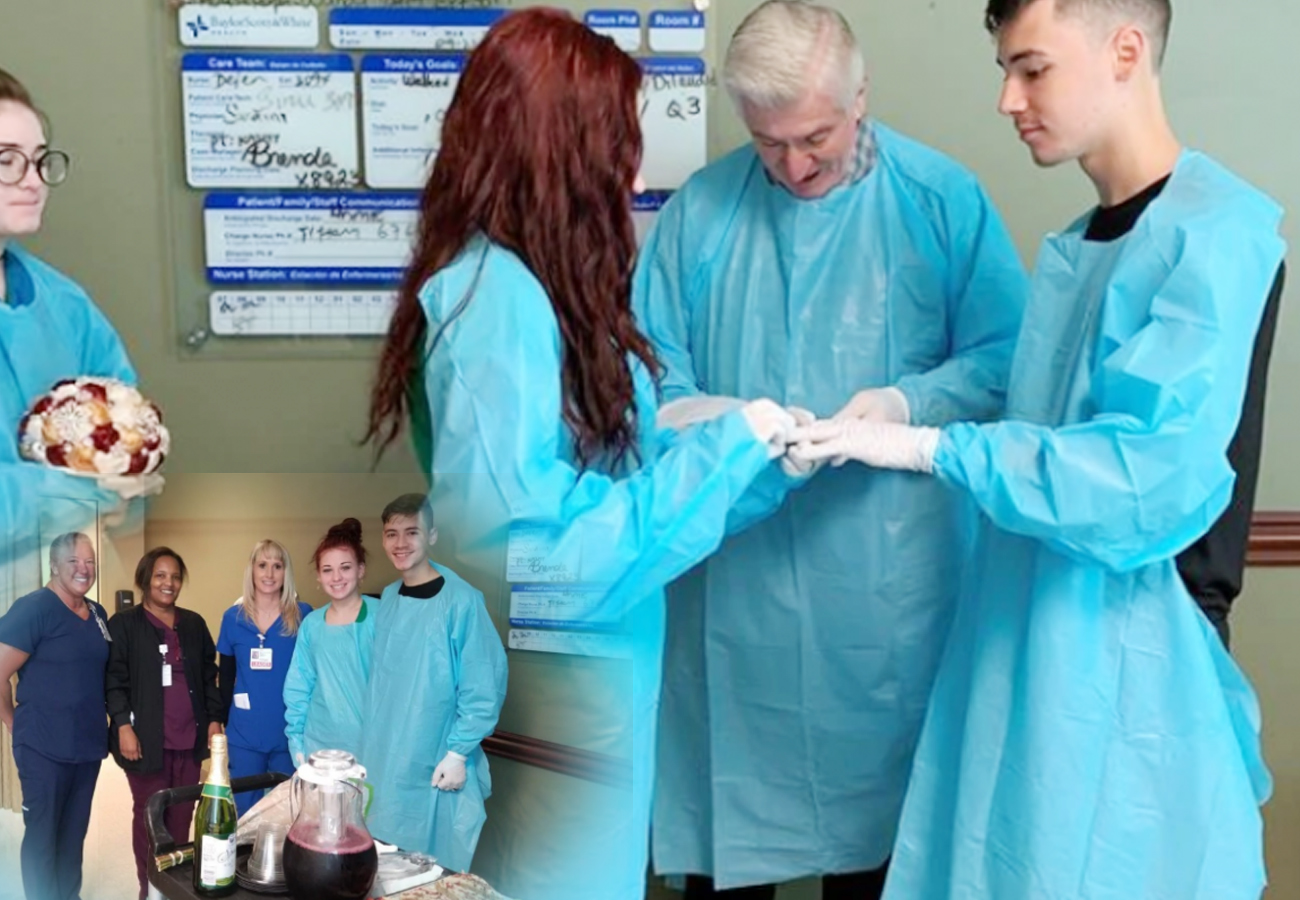
One-Of-A-Kind Wedding: After Groom's Father Gets A
-
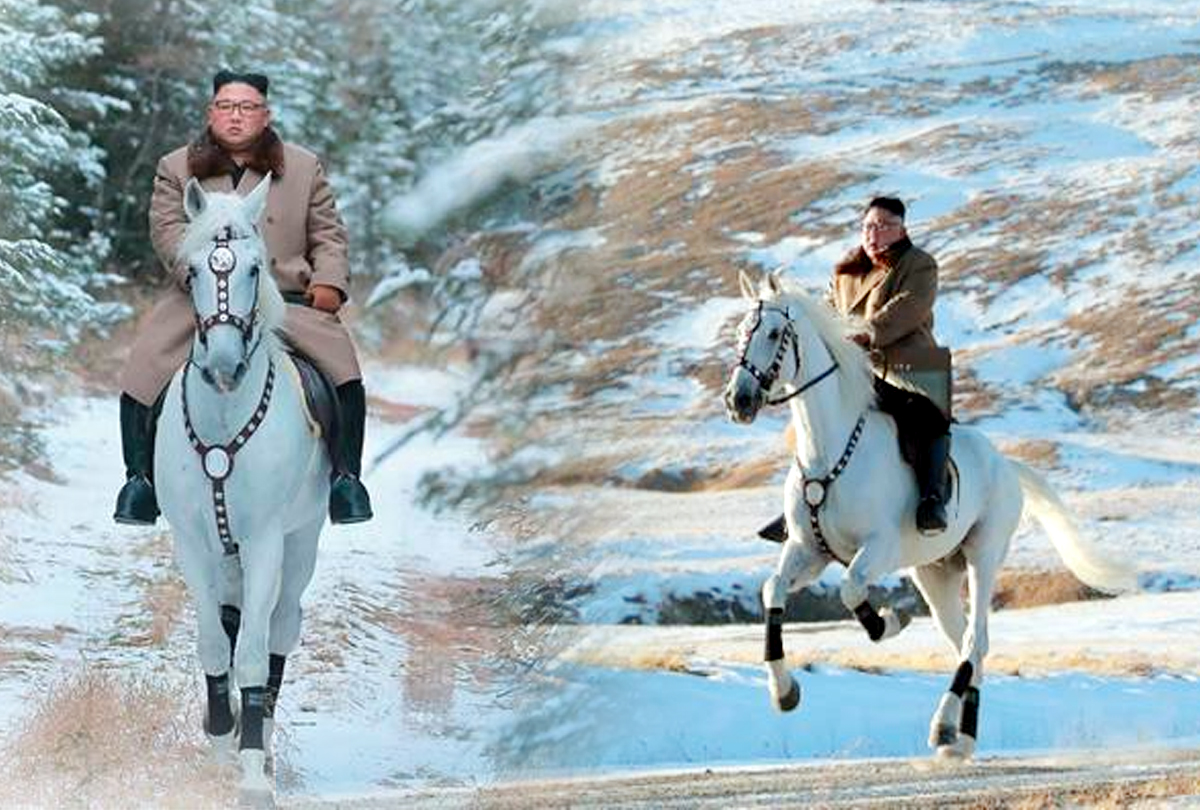
Kim's Horse Ride On Sacred Mountain Hints At "Grea
-
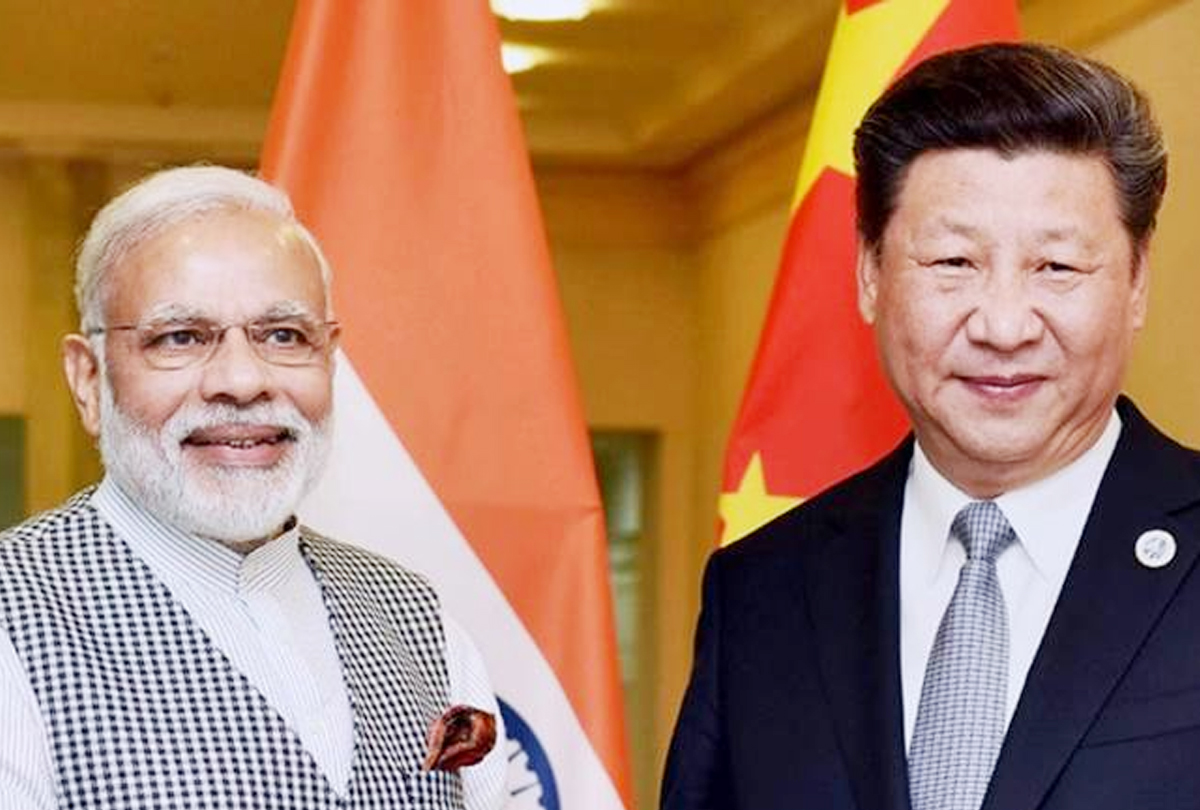
Chinese President’s India visit on track, confirms
-
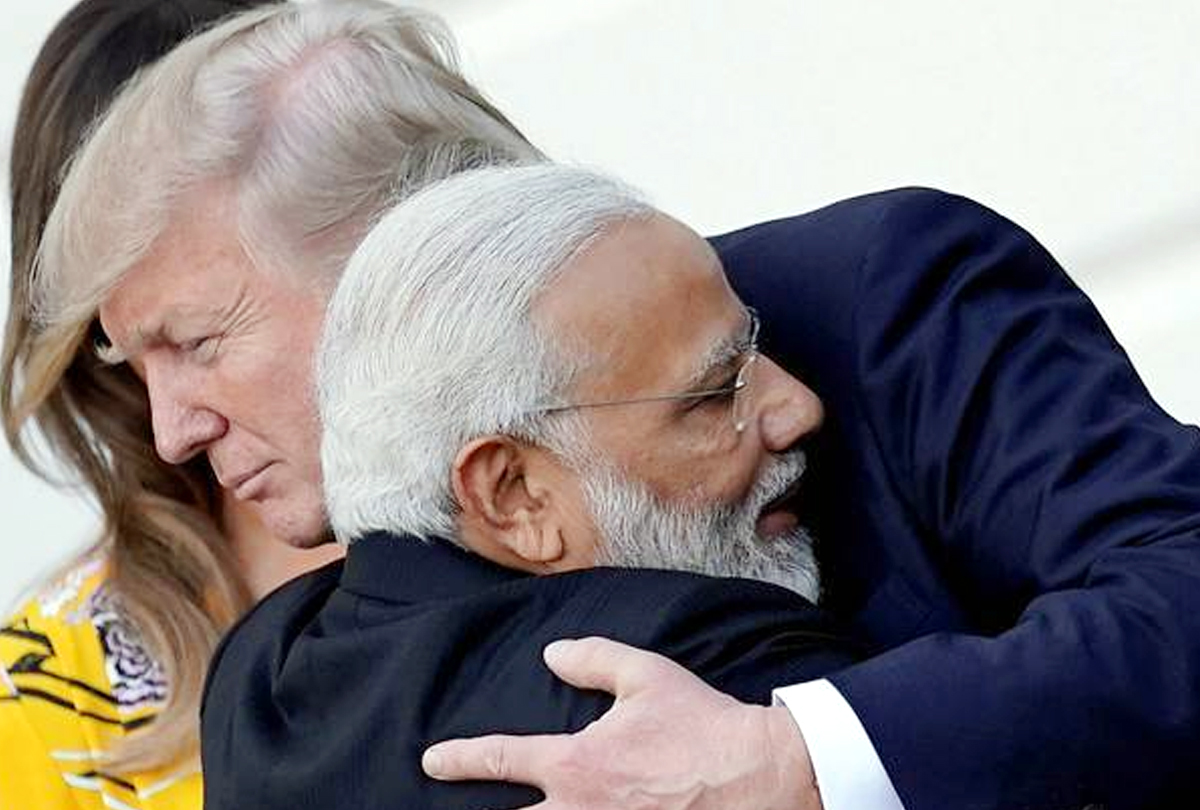
'Howdy Modi' event 'win-win' situation for Modi an
-
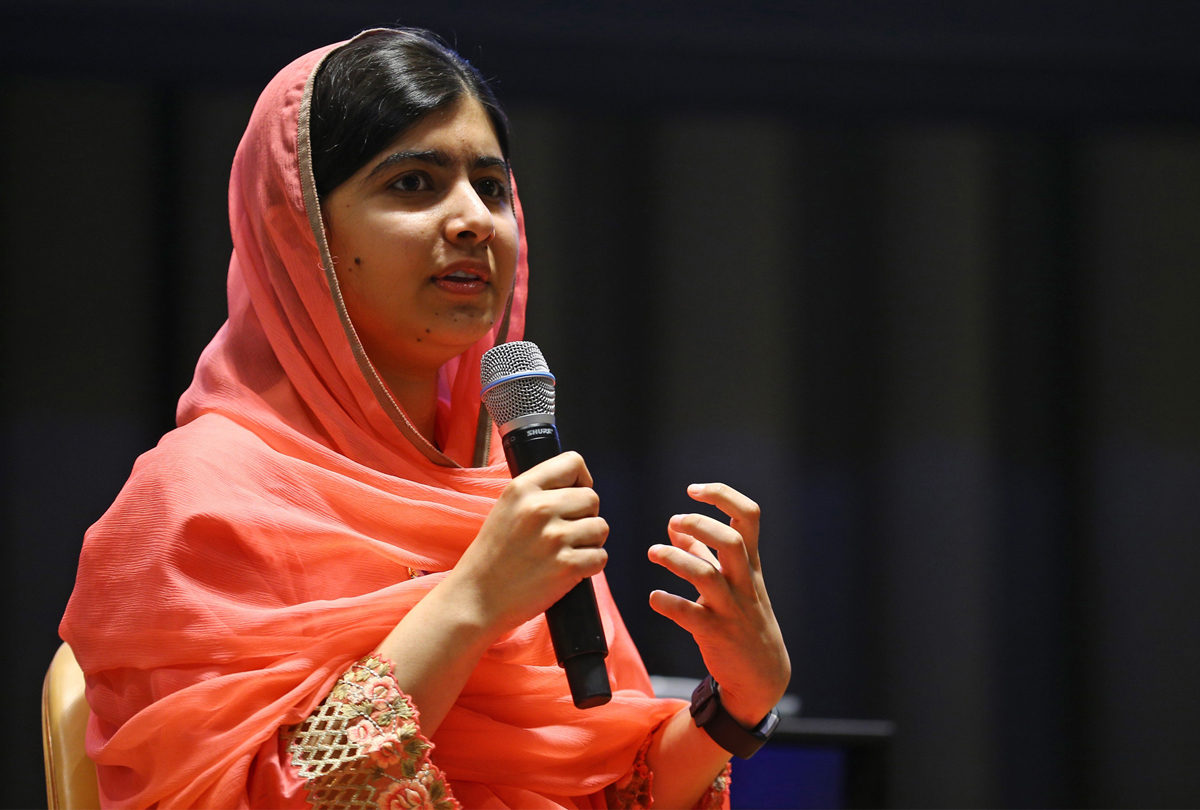
Malala urges U.N. to help Kashmiri children go bac
-
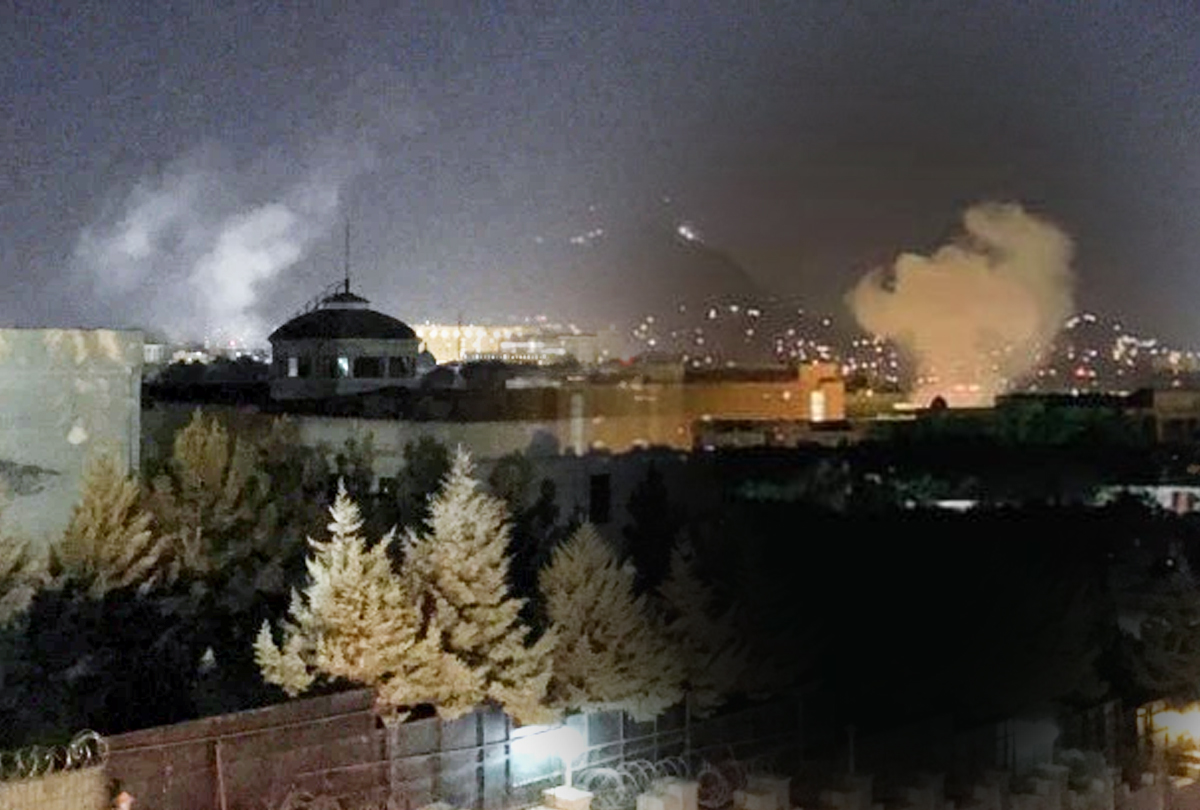
Rocket blast at U.S. Embassy in Kabul on 9/11 anni
-
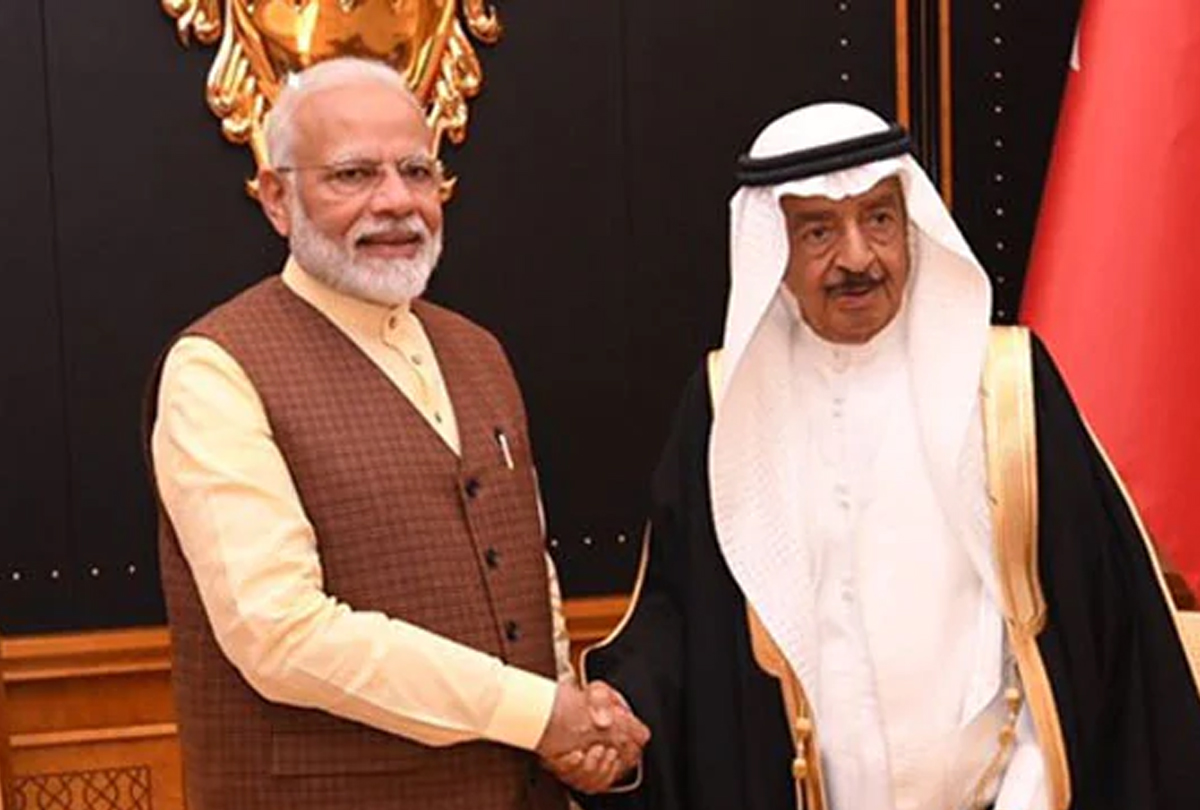
PM Modi launches $4.2 mn redevelopment project of
-
Pakistan Blacklisted by FATF's: After Failing to A

-
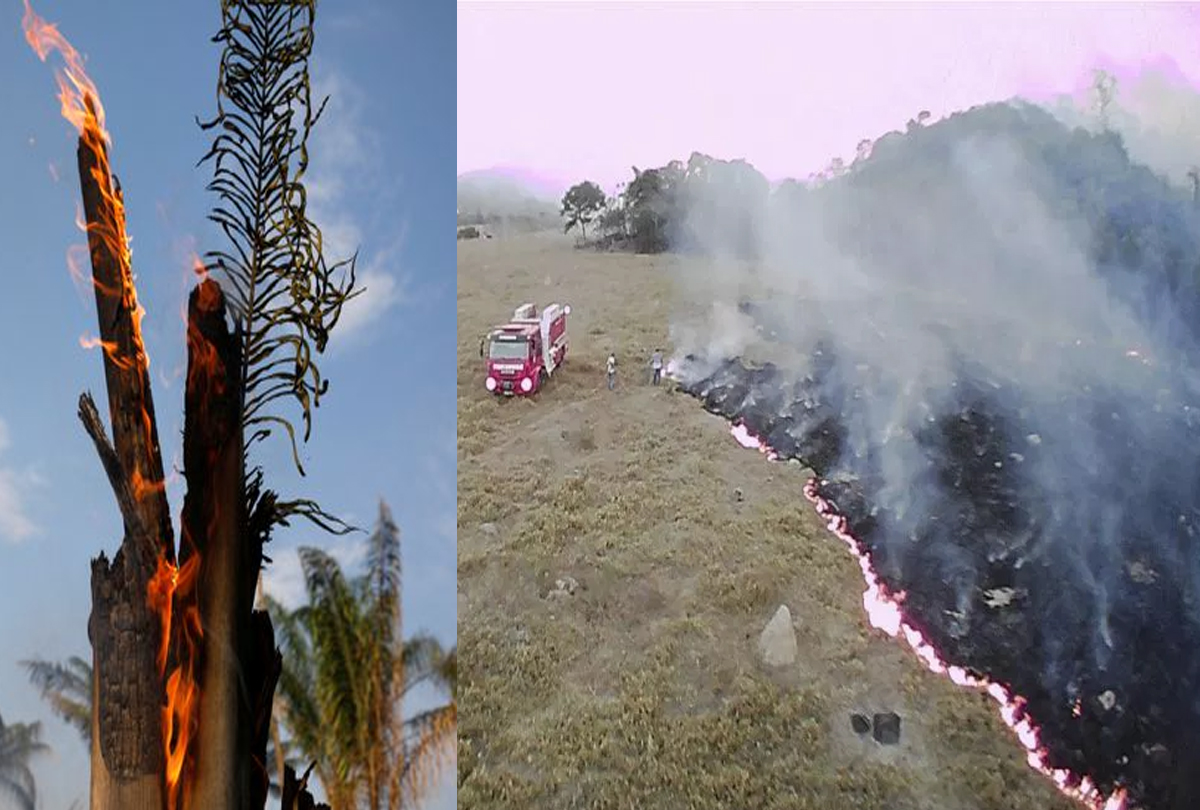
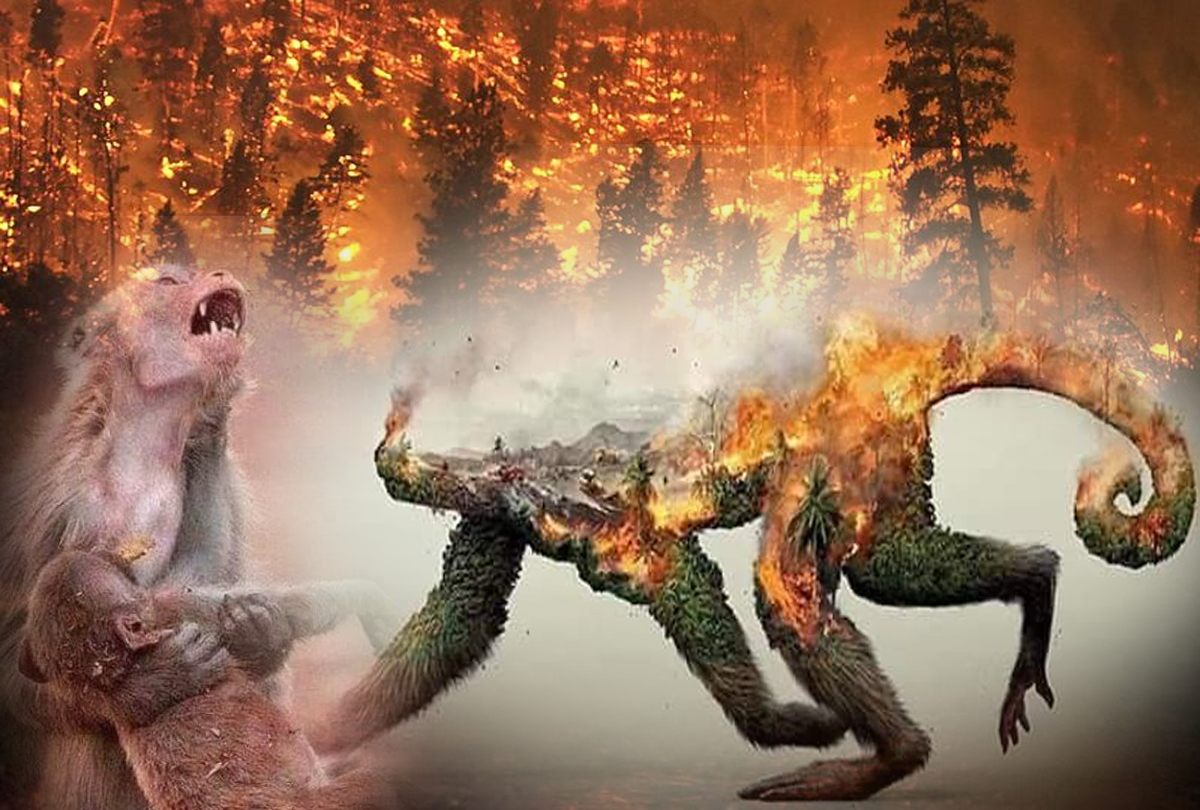
Amazon Rainforest burning: Brazil President tells
-
10 shoking pics of Amazon Rainforest Burning
-
200 pakistan twitter accounts suspended on kashmir
-
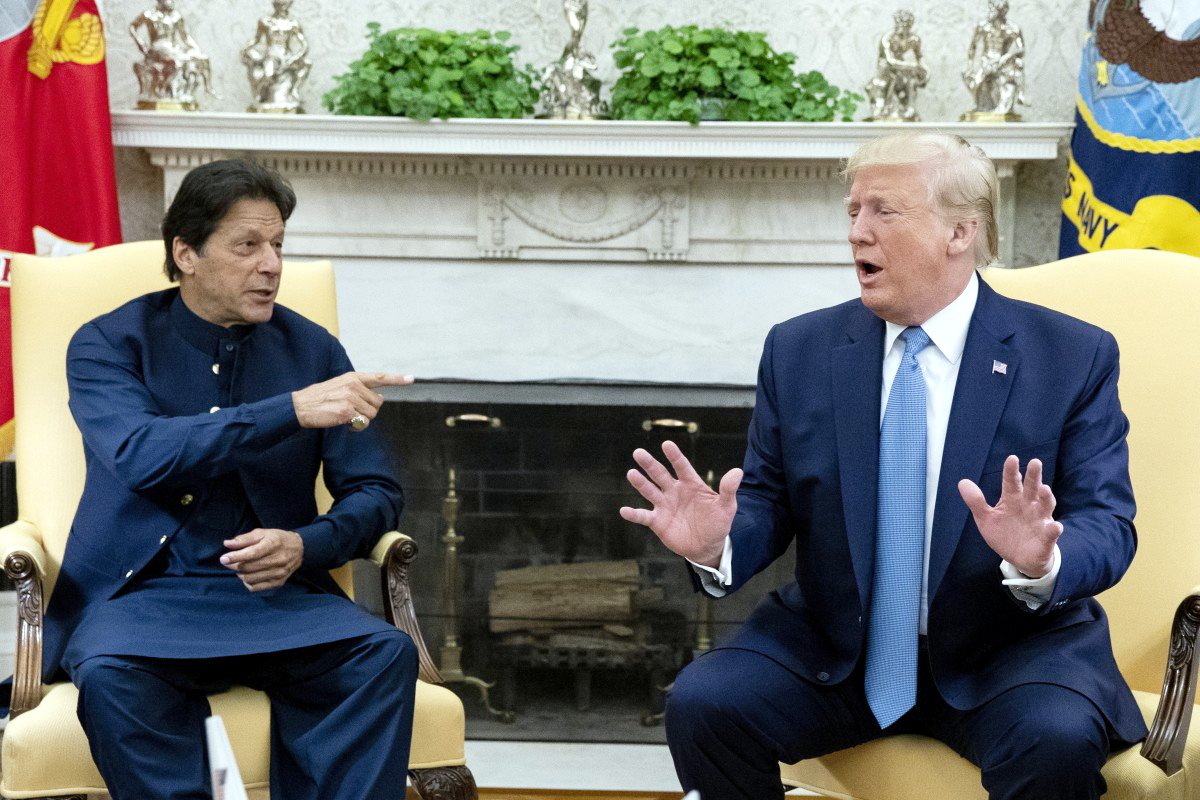
Trump dials Imran Khan, asks to ‘moderate rhetoric
-
No policy change on Kashmir, says U.S.
-
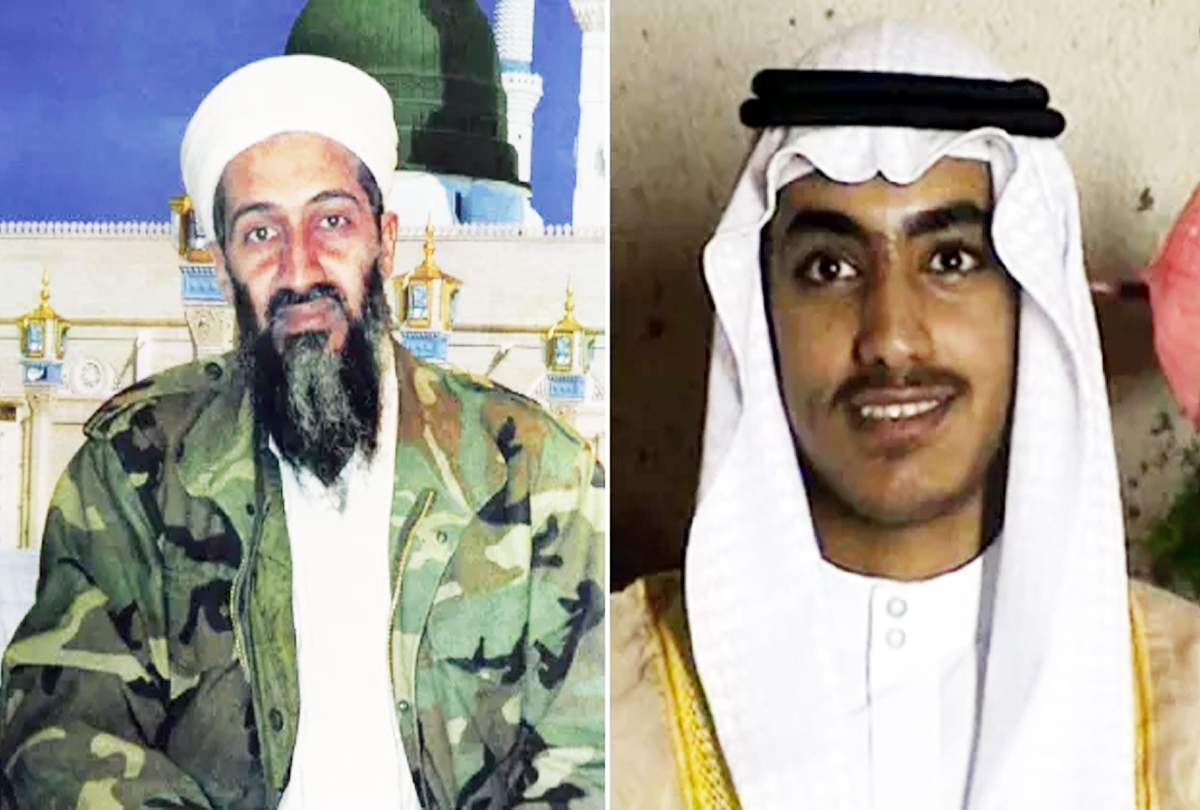
Hamza, the son of Osama bin Laden, is dead
-
Ethiopians planted more than 200 million trees in
-
Pakistani military aircraft crash: All 5 crew memb